如果您读了上周五我在发表的原创博客文章 - 可视化oracle性能图表之“平均活动会话”篇,我想您对oracle的平均活动会话一定有所了解,尤其是我从八个维度展现的可视化图表。在那篇文章的最后我曾提到我的下一篇文章将是可视化oracle性能图表之“平均活动会话&逻辑cpu”篇。那么,请让我娓娓道来。
同理,我们仍然是从八个维度来依次阐述。如果您觉得说来话长,那我们就长话短说。哈哈......
维度目录列表
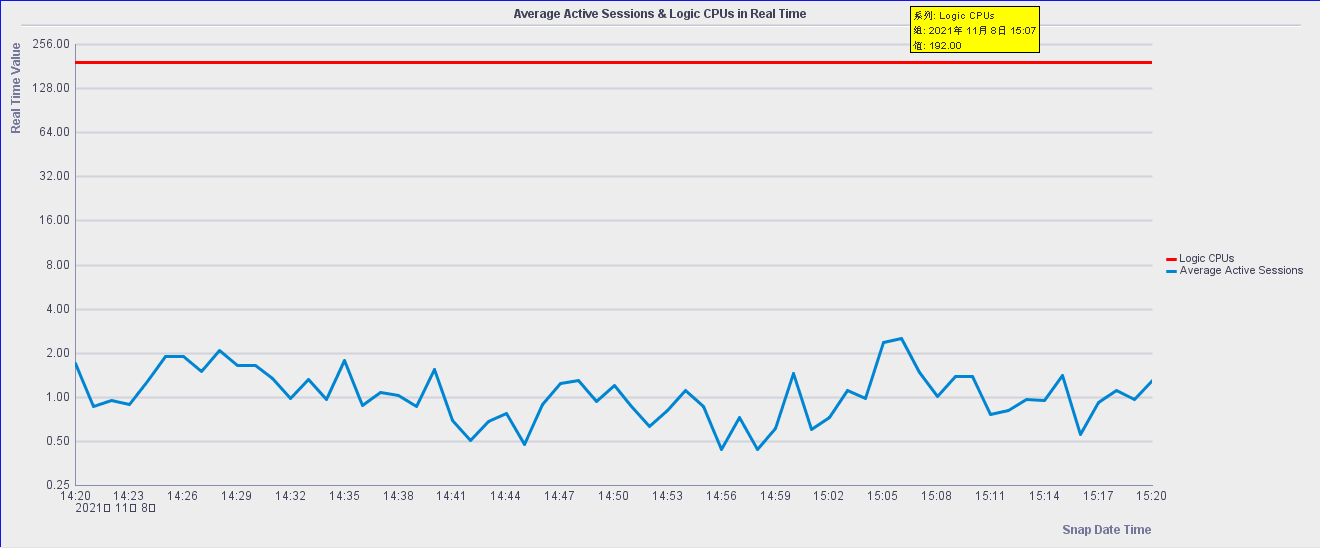
实时的平均活动会话和逻辑cpu数目
话不多说,直接上代码:
-- average active sessions & logic cpus in real time.
set linesize 200
set pagesize 200
column snap_date_time format a19
column stat_name      format a25
column stat_value     format 999,999.99
alter session set nls_date_format = 'yyyy-mm-dd hh24:mi:ss';
with aas as
(
  select to_char(end_time, 'yyyy-mm-dd hh24:mi:ss') snap_date_time
       , metric_name
       , round(value, 2) aas
  from v$sysmetric_history
  where metric_name = 'average active sessions'
  and   group_id = 2
),
oscpu as
(
  select stat_name
       , value
  from v$osstat
  where stat_name = 'num_cpus'
)
select s.snap_date_time                                         -- the group column
     , decode(u.stat_name, 'num_cpus', 'logic cpus') stat_name  -- the series column
     , u.value stat_value                                       -- the value column
from oscpu u  -- "oscpu" has only a row, so using "oscpu" and "aas" to join each other to acquire the column "snap_date_time" of "aas".
   , aas s
union all
select snap_date_time         -- the group column
     , metric_name stat_name  -- the series column
     , aas stat_value         -- the value column
from aas
order by stat_name desc
       , snap_date_time
;
再上图,
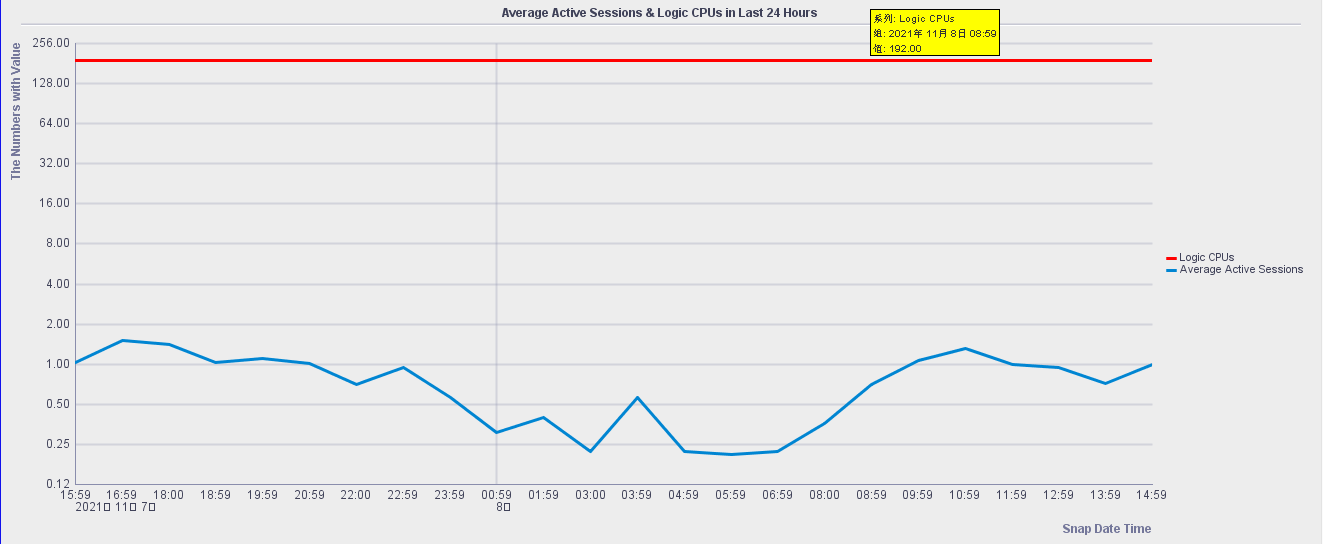
最近24小时的平均活动会话和逻辑cpu数目
sql代码如下:
-- average active sessions & logic cpus in last 24 hours.
set linesize 200
set pagesize 200
column snap_date_time format a19
column stat_name      format a25
column stat_value     format 999,999.99
alter session set nls_date_format = 'yyyy-mm-dd hh24:mi:ss';
with aas as
(
  select snap_id
       , dbid
       , instance_number
       , to_char(end_time, 'yyyy-mm-dd hh24:mi:ss') snap_date_time
       , metric_name
       , round(average, 2) aas
  from dba_hist_sysmetric_summary
  where metric_name = 'average active sessions'
  and   end_time >= sysdate - 1
),
oscpu as
(
  select snap_id
       , dbid
       , instance_number
       , stat_name
       , value
  from dba_hist_osstat
  where stat_name = 'num_cpus'
)
select s.snap_date_time                                         -- the group column
     , decode(u.stat_name, 'num_cpus', 'logic cpus') stat_name  -- the series column
     , u.value stat_value                                       -- the value column
from aas s
   , oscpu u
where s.snap_id = u.snap_id
and   s.dbid = u.dbid
and   s.instance_number = u.instance_number
union all
select snap_date_time         -- the group column
     , metric_name stat_name  -- the series column
     , aas stat_value         -- the value column
from aas
order by stat_name desc
       , snap_date_time
;
可视化的图表为:
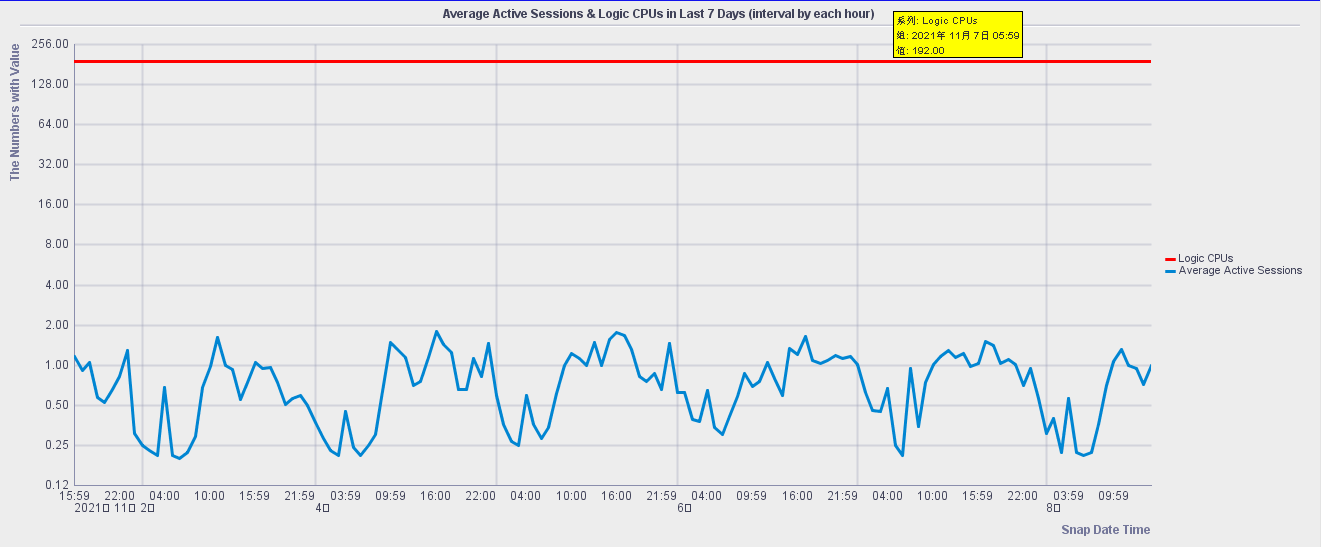
最近7天的平均活动会话和逻辑cpu数目(按每小时间隔)
sql代码是这样的:
-- average active sessions & logic cpus in last 7 days (interval by each hour).
set linesize 200
set pagesize 200
column snap_date_time format a19
column stat_name      format a25
column stat_value     format 999,999.99
alter session set nls_date_format = 'yyyy-mm-dd hh24:mi:ss';
with aas as
(
  select snap_id
       , dbid
       , instance_number
       , to_char(end_time, 'yyyy-mm-dd hh24:mi:ss') snap_date_time
       , metric_name
       , round(average, 2) aas
  from dba_hist_sysmetric_summary
  where metric_name = 'average active sessions'
  and   end_time >= sysdate - 6
),
oscpu as
(
  select snap_id
       , dbid
       , instance_number
       , stat_name
       , value
  from dba_hist_osstat
  where stat_name = 'num_cpus'
)
select s.snap_date_time                                         -- the group column
     , decode(u.stat_name, 'num_cpus', 'logic cpus') stat_name  -- the series column
     , u.value stat_value                                       -- the value column
from aas s
   , oscpu u
where s.snap_id = u.snap_id
and   s.dbid = u.dbid
and   s.instance_number = u.instance_number
union all
select snap_date_time         -- the group column
     , metric_name stat_name  -- the series column
     , aas stat_value         -- the value column
from aas
order by stat_name desc
       , snap_date_time
;
那么,对应的图表如下所示:
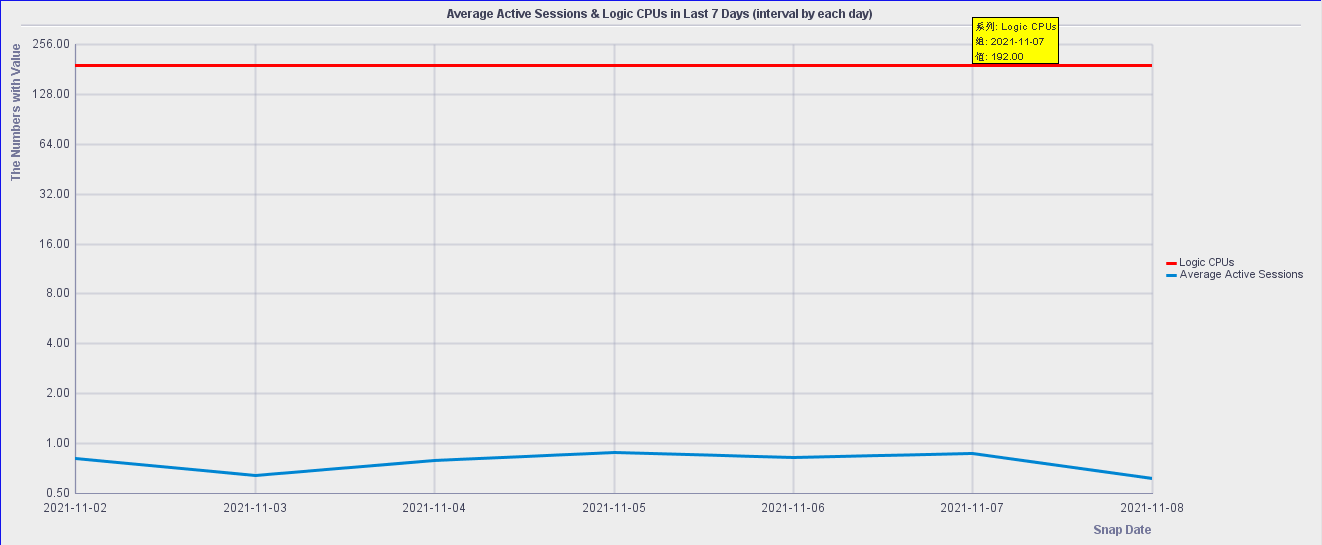
最近7天的平均活动会话和逻辑cpu数目(按每天间隔)
具体的sql查询代码如下:
-- average active sessions & logic cpus in last 7 days (interval by each day).
set linesize 200
set pagesize 200
column snap_date  format a12
column stat_name  format a25
column stat_value format 999,999.99
alter session set nls_date_format = 'yyyy-mm-dd hh24:mi:ss';
with aas_per_hour as
(
  select snap_id
       , dbid
       , instance_number
       , to_char(end_time, 'yyyy-mm-dd') snap_date
       , metric_name
       , average
  from dba_hist_sysmetric_summary
  where metric_name = 'average active sessions'
  and   end_time >= sysdate - 6
),
aas as
(
  select snap_date                                    -- the group column
       , metric_name                                  -- the series column
       , round(sum(average)/count(snap_date), 2) aas  -- the value column
  from aas_per_hour
  group by snap_date
         , metric_name
),
oscpu as
(
  select snap_id
       , dbid
       , instance_number
       , stat_name
       , value
  from dba_hist_osstat
  where stat_name = 'num_cpus'
)
select distinct s.snap_date                                     -- the group column
     , decode(u.stat_name, 'num_cpus', 'logic cpus') stat_name  -- the series column
     , u.value stat_value                                       -- the value column
from aas_per_hour s
   , oscpu u
where s.snap_id = u.snap_id
and   s.dbid = u.dbid
and   s.instance_number = u.instance_number
union all
select snap_date              -- the group column
     , metric_name stat_name  -- the series column
     , aas stat_value         -- the value column
from aas
order by stat_name desc
       , snap_date
;
对应的可视化图表见下图:
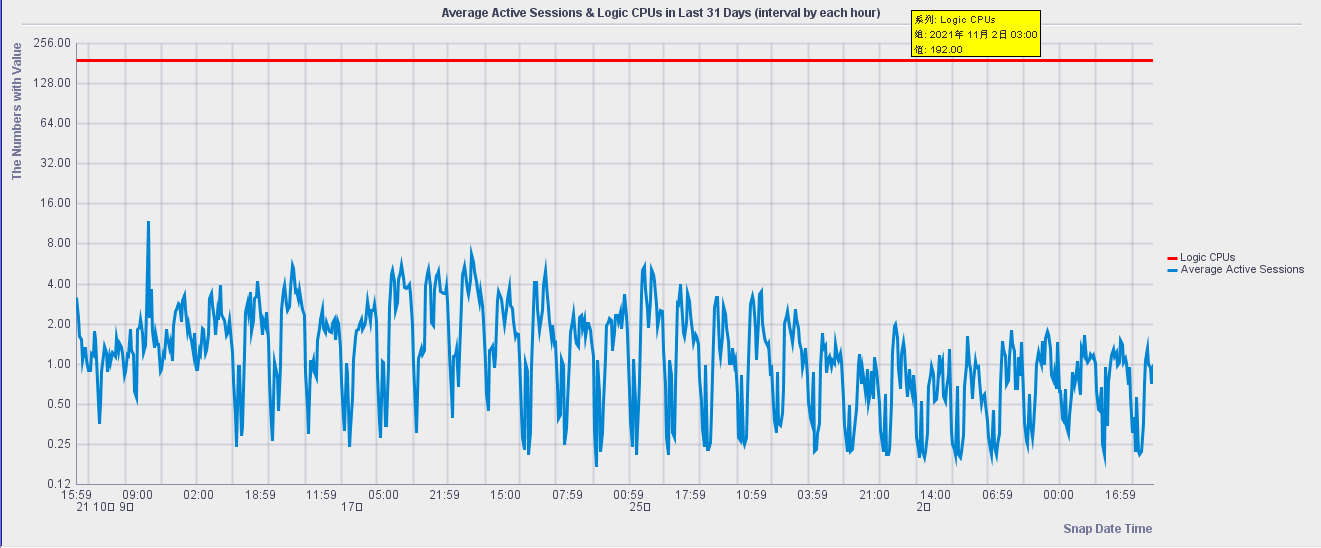
最近31天的平均活动会话和逻辑cpu数目(按每小时间隔)
完整的sql代码详见下面的查询语句:
-- average active sessions & logic cpus in last 31 days (interval by each hour).
set linesize 200
set pagesize 200
column snap_date_time format a19
column stat_name      format a25
column stat_value     format 999,999.99
alter session set nls_date_format = 'yyyy-mm-dd hh24:mi:ss';
with aas as
(
  select snap_id
       , dbid
       , instance_number
       , to_char(end_time, 'yyyy-mm-dd hh24:mi:ss') snap_date_time
       , metric_name
       , round(average, 2) aas
  from dba_hist_sysmetric_summary
  where metric_name = 'average active sessions'
  and   end_time >= sysdate - 30
),
oscpu as
(
  select snap_id
       , dbid
       , instance_number
       , stat_name
       , value
  from dba_hist_osstat
  where stat_name = 'num_cpus'
)
select s.snap_date_time                                         -- the group column
     , decode(u.stat_name, 'num_cpus', 'logic cpus') stat_name  -- the series column
     , u.value stat_value                                       -- the value column
from aas s
   , oscpu u
where s.snap_id = u.snap_id
and   s.dbid = u.dbid
and   s.instance_number = u.instance_number
union all
select snap_date_time         -- the group column
     , metric_name stat_name  -- the series column
     , aas stat_value         -- the value column
from aas
order by stat_name desc
       , snap_date_time
;
同理,对应的可视化图表如下图所示:
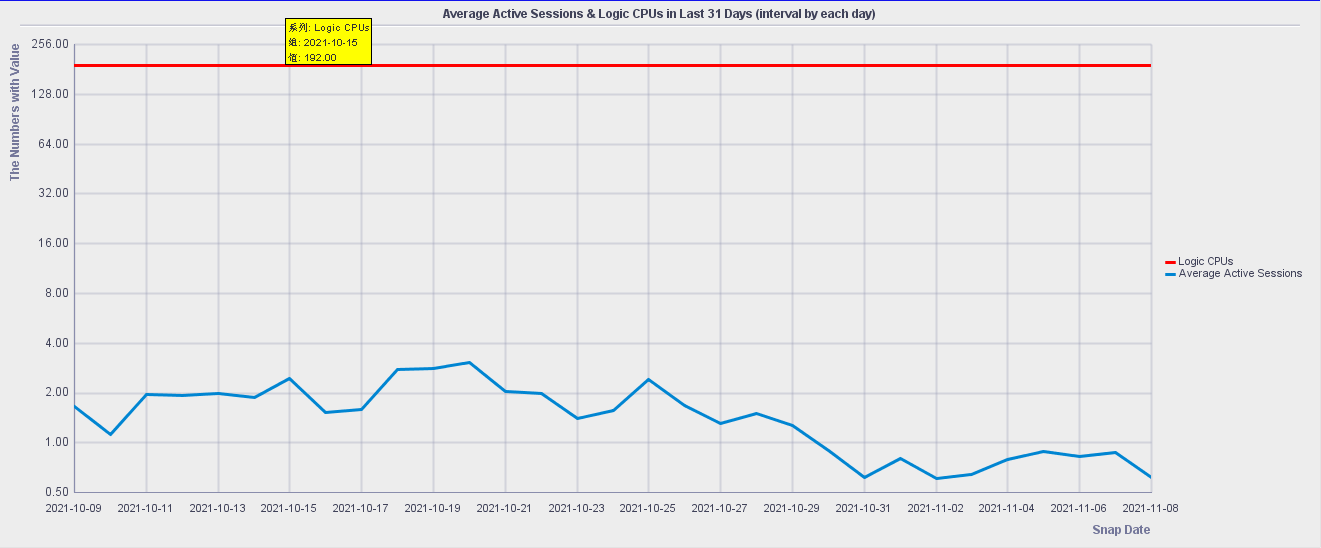
最近31天的平均活动会话和逻辑cpu数目(按每天间隔)
sql查询语句如下:
-- average active sessions & logic cpus in last 31 days (interval by each day).
set linesize 200
set pagesize 200
column snap_date  format a12
column stat_name  format a25
column stat_value format 999,999.99
alter session set nls_date_format = 'yyyy-mm-dd hh24:mi:ss';
with aas_per_hour as
(
  select snap_id
       , dbid
       , instance_number
       , to_char(end_time, 'yyyy-mm-dd') snap_date
       , metric_name
       , average
  from dba_hist_sysmetric_summary
  where metric_name = 'average active sessions'
  and   end_time >= sysdate - 30
),
aas as
(
  select snap_date                                    -- the group column
       , metric_name                                  -- the series column
       , round(sum(average)/count(snap_date), 2) aas  -- the value column
  from aas_per_hour
  group by snap_date
         , metric_name
),
oscpu as
(
  select snap_id
       , dbid
       , instance_number
       , stat_name
       , value
  from dba_hist_osstat
  where stat_name = 'num_cpus'
)
select distinct s.snap_date                                     -- the group column
     , decode(u.stat_name, 'num_cpus', 'logic cpus') stat_name  -- the series column
     , u.value stat_value                                       -- the value column
from aas_per_hour s
   , oscpu u
where s.snap_id = u.snap_id
and   s.dbid = u.dbid
and   s.instance_number = u.instance_number
union all
select snap_date              -- the group column
     , metric_name stat_name  -- the series column
     , aas stat_value         -- the value column
from aas
order by stat_name desc
       , snap_date
;
那么,这个查询维度的图表是下面这个样子:
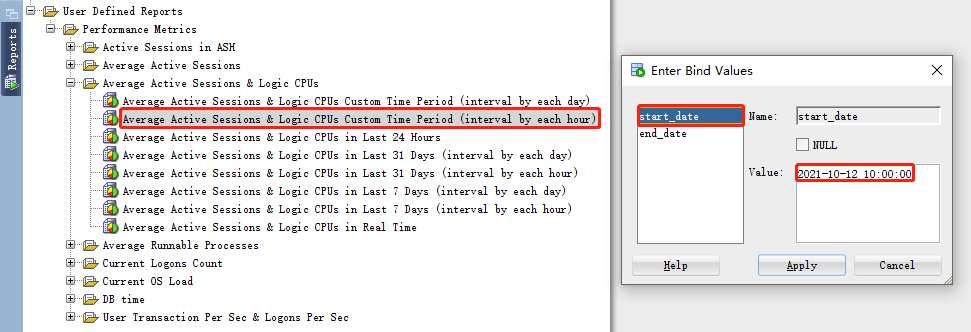
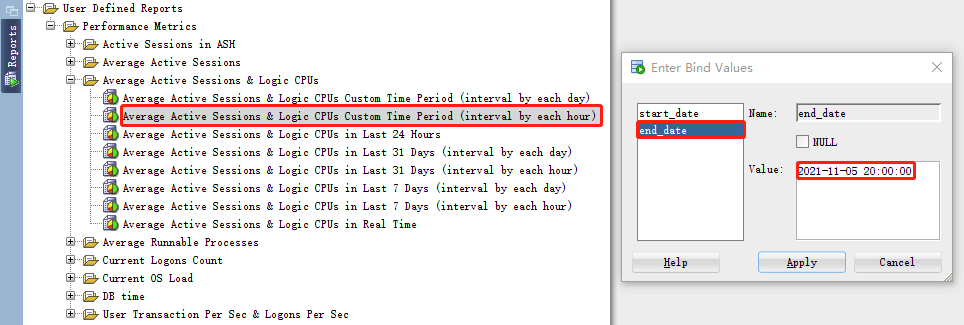
自定义时间段的平均活动会话和逻辑cpu数目(按每小时间隔)
对应的sql查询见下面的代码:
-- average active sessions & logic cpus custom time period (interval by each hour).
set linesize 200
set pagesize 200
column snap_date_time format a19
column stat_name      format a25
column stat_value     format 999,999.99
alter session set nls_date_format = 'yyyy-mm-dd hh24:mi:ss';
with aas as
(
  select snap_id
       , dbid
       , instance_number
       , to_char(end_time, 'yyyy-mm-dd hh24:mi:ss') snap_date_time
       , metric_name
       , round(average, 2) aas
  from dba_hist_sysmetric_summary
  where metric_name = 'average active sessions'
  and   (end_time between to_date(:start_date, 'yyyy-mm-dd hh24:mi:ss')
                  and     to_date(:end_date, 'yyyy-mm-dd hh24:mi:ss')
        )
),
oscpu as
(
  select snap_id
       , dbid
       , instance_number
       , stat_name
       , value
  from dba_hist_osstat
  where stat_name = 'num_cpus'
)
select s.snap_date_time                                         -- the group column
     , decode(u.stat_name, 'num_cpus', 'logic cpus') stat_name  -- the series column
     , u.value stat_value                                       -- the value column
from aas s
   , oscpu u
where s.snap_id = u.snap_id
and   s.dbid = u.dbid
and   s.instance_number = u.instance_number
union all
select snap_date_time         -- the group column
     , metric_name stat_name  -- the series column
     , aas stat_value         -- the value column
from aas
order by stat_name desc
       , snap_date_time
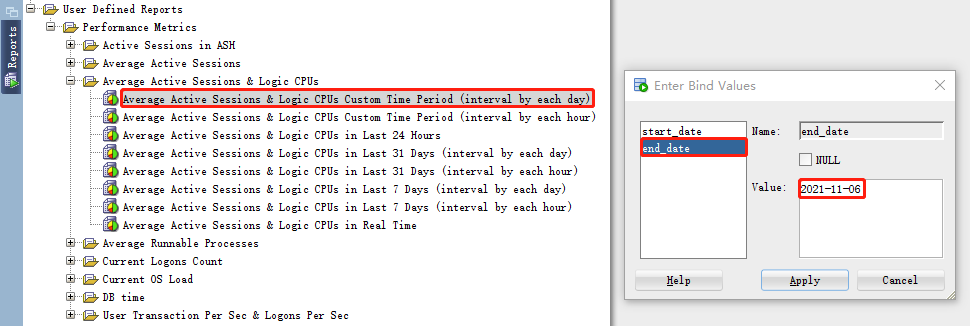
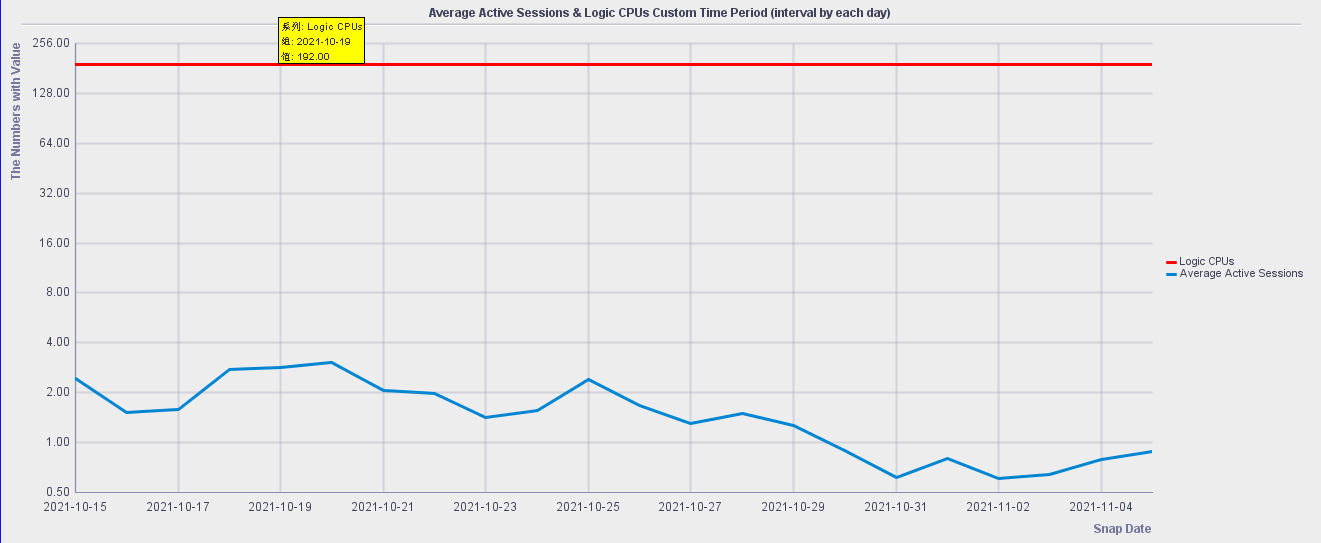
;那么,它的可视化图表详见下面的3个屏幕截图(1. 绑定变量“起始时间”,2. 绑定变量“结束时间”,3. 生成的可视化图表):
自定义时间段的平均活动会话和逻辑cpu数目(按每天间隔)
这个维度的sql查询语句是:
-- average active sessions & logic cpus custom time period (interval by each day).
set linesize 200
set pagesize 200
column snap_date  format a12
column stat_name  format a25
column stat_value format 999,999.99
alter session set nls_date_format = 'yyyy-mm-dd hh24:mi:ss';
with aas_per_hour as
(
  select snap_id
       , dbid
       , instance_number
       , to_char(end_time, 'yyyy-mm-dd') snap_date
       , metric_name
       , average
  from dba_hist_sysmetric_summary
  where metric_name = 'average active sessions'
  and   (end_time between to_date(:start_date, 'yyyy-mm-dd')
                  and     to_date(:end_date, 'yyyy-mm-dd')
        )
),
aas as
(
  select snap_date                                    -- the group column
       , metric_name                                  -- the series column
       , round(sum(average)/count(snap_date), 2) aas  -- the value column
  from aas_per_hour
  group by snap_date
         , metric_name
),
oscpu as
(
  select snap_id
       , dbid
       , instance_number
       , stat_name
       , value
  from dba_hist_osstat
  where stat_name = 'num_cpus'
)
select distinct s.snap_date                                     -- the group column
     , decode(u.stat_name, 'num_cpus', 'logic cpus') stat_name  -- the series column
     , u.value stat_value                                       -- the value column
from aas_per_hour s
   , oscpu u
where s.snap_id = u.snap_id
and   s.dbid = u.dbid
and   s.instance_number = u.instance_number
union all
select snap_date              -- the group column
     , metric_name stat_name  -- the series column
     , aas stat_value         -- the value column
from aas
order by stat_name desc
       , snap_date
;同理,和上一个维度的图表相似,见下面3个屏幕截图:
可视化oracle性能图表之“平均活动会话&逻辑cpu”篇的分享就到这里结束了。虽然它的篇幅没有上一篇冗长,但是两者的思路和方法论具有异曲同工之妙,只能说是在前一篇的基础上进行了更深层次的升华。因为,首先要让读者明白什么是aas,我不得不把曾读过和学习到的一些素材进行处理和加工,其次再以文字的形式表达出来。同时,进行一下剧透,我的下一篇文章将是可视化oracle性能图表之“平均可运行进程”篇(可视化oracle性能图表之“每秒事务数&每秒登录数”篇),敬请期待!!!
补充:
- 将保存到您的电脑并用鼠标右击oracle sql developer的用户自定义报告,然后选择“打开报告”,点选该xml文件进行导入;
- 您也可以从查看这篇文章中提及到的所有sql源代码;
更新于 2021年11月9日 下午:
- 替换之前的“无序项目列表”的所有html代码(锚点设置)中的链接为在“当前页面”之内跳转而不是在“新窗口”打开;如,之前是 "_blank">......,之后是 "_parent">......;
- 替换之前的“[返回维度目录列表]”的所有html代码(锚点设置)中的链接为“真正返回到维度目录列表”而不是打开“新窗口”;如,之前是 "_blank">[返回维度目录列表],之后是 "_parent">[返回维度目录列表];
更新于 2021年11月25日 上午:
- 计划有变,更改文章结尾段落中的剧透内容为可视化oracle性能图表之“平均可运行进程”篇;
最后修改时间:2021-11-25 11:01:55
【米乐app官网下载的版权声明】本文为墨天轮用户原创内容,转载时必须标注文章的来源(墨天轮),文章链接,文章作者等基本信息,否则作者和墨天轮有权追究责任。如果您发现墨天轮中有涉嫌抄袭或者侵权的内容,欢迎发送邮件至:contact@modb.pro进行举报,并提供相关证据,一经查实,墨天轮将立刻删除相关内容。